There are existing services like pingdom or uptimerobot to check if your network services are up and running. But as always I like to be independent of service providers and host as much by myself as possible. So let's build our own uptime monitoring with Prometheus, Grafana, alertmanager and the Prometheus blackbox-exporter.
The general idea is to check if a service is up with the blackbox-exporter. Then scrape this metrics with Prometheus and store it for further usage. Build a simple dashboard with Grafana for visualization and finally setup alerting with alertmanager. As this uses a few projects on the Prometheus ecosystem, this is a perfect example on how to integreate these different components.
The end result will look like this: 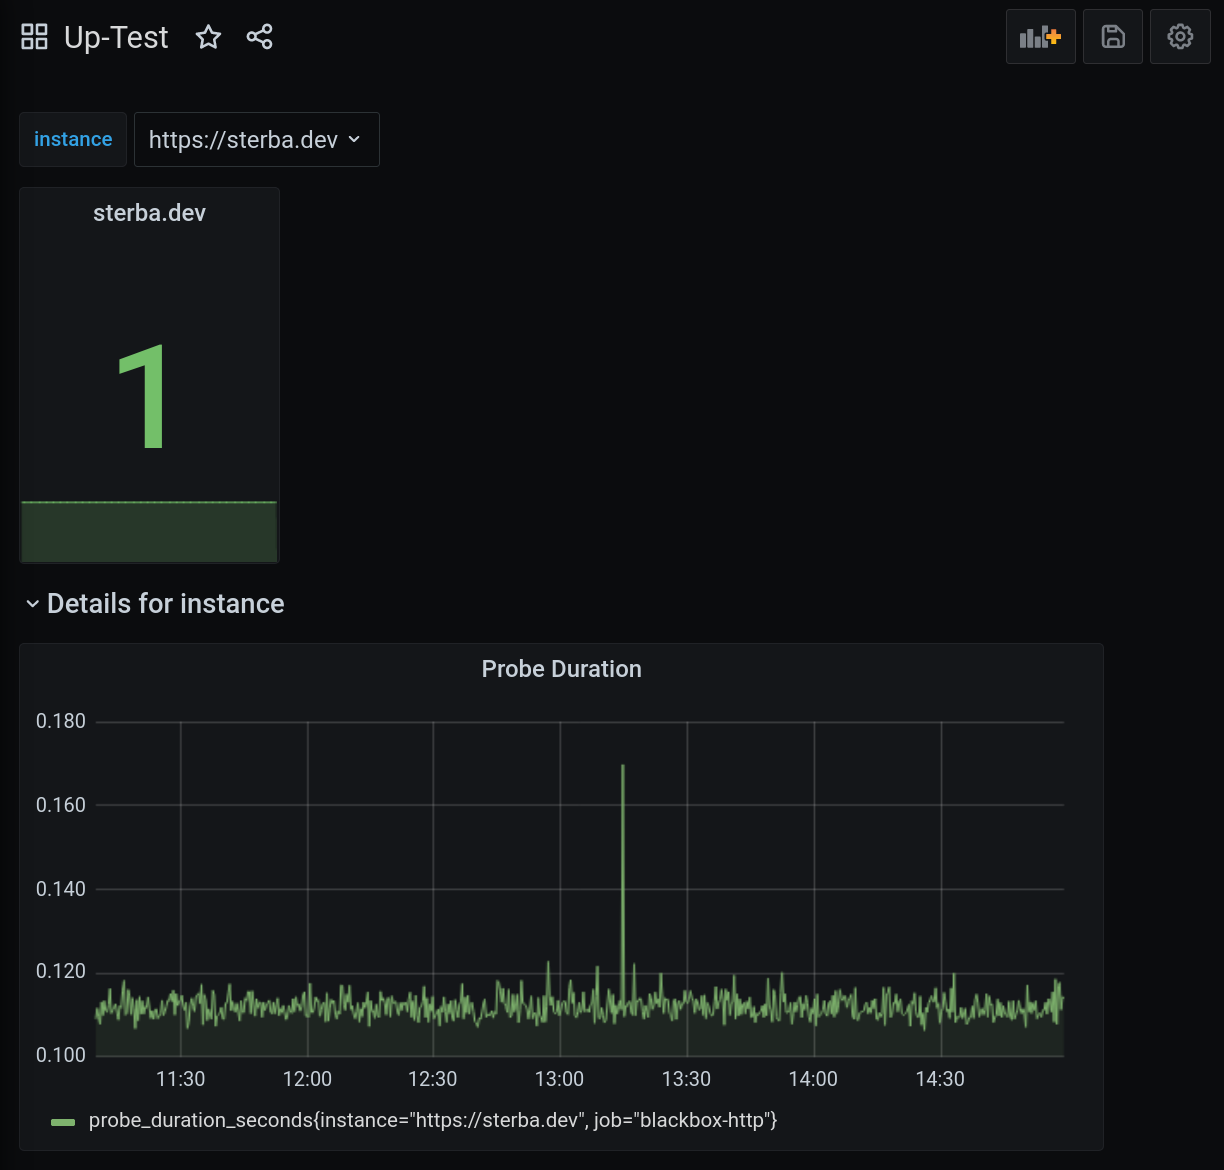
What is uptime monitoring?
In this example we will monitor http services (in this case my blog) and a simple TCP service (e.g. a teamspeak3 server). So what does uptime mean? In this case it means the service should be accessible via HTTP or TCP and therefore the user should be able to use it.
There are more advanced services like the already mentioned pingdom where you can also check for specific parts on a HTTP page, but let's go for a basic setup which will simply check if we get any http 2xx response or can create a TCP connection to the service.
Another interesting dashboard or metric is the actual time since the last downtime of the service.
Setup Prometheus/Exporter/Alertmanager
So let's get started with setting up all needed components. The directories should look like this, to be able to provide all services with the needed configurations:
.
├── alertmanager
│   └── config.yml
├── blackbox-exporter
│   └── blackbox.yml
├── docker-compose.yml
├── grafana
│   ├── config.monitoring.example
│   └── provisioning
│       ├── dashboards
│       │   └── dashboard.yml
│       └── datasources
│           └── datasource.yml
├── prometheus
│   ├── prometheus.yml
│   └── uptime.rules
The whole setup can be found in my GitHub repository. But let's take a look into the most important configurations.
The blackbox-exporter is configured via a simple blackbox.yml. In this case I configured a basic HTTP probe with the http_2xx module and the tcp_connect module. There are more modules for e.g. icmp, dns and grpc, which can be used to monitor services with other protocols.
modules:
  http_2xx:
    prober: http
    timeout: 5s
    http:
      tls_config:
        insecure_skip_verify: false
  tcp_connect:
    prober: tcp
    timeout: 5s
    tcp:
      preferred_ip_protocol: ip4
The next component to configure is Alertmanager, which will send alerts to a single or multiple recievers. In this case I want to be alerted via mail, but you can choose whatever reciever is the perfect match for you.
route:
  receiver: 'default-receiver'
  group_wait: 30s
  group_interval: 5m
  repeat_interval: 12h

receivers:
  - name: 'default-receiver'
    email_configs:
        - send_resolved: true
          to: ''
          from: 'monitoring@mydomain.com'
          smarthost: ':587'
          auth_username: 'hello'
          auth_password: 'changeme'
Now to the target configuration within the Prometheus config. Most of this config is more or less a plain Prometheus config. There are two additions:
- Additional
uptime.ruleswith rules for the case of a service downtime. - A
scrape_configfor the blackbox-exporter.
You can add as many targets as you want. The exporter will probe them, and you can query them with probe_success via PromQL.
global:
    scrape_interval: 15s
    evaluation_interval: 15s

    external_labels:
        monitor: "my-domain"

rule_files:
    - "uptime.rules"

alerting:
    alertmanagers:
        - scheme: http
          static_configs:
              - targets:
                    - "alertmanager:9093"

scrape_configs:
    - job_name: 'blackbox-http'
      metrics_path: /probe
      params:
        module: [http_2xx]
      static_configs:
        - targets:
          - https://sterba.dev
      relabel_configs:
        - source_labels: [__address__]
          target_label: __param_target
        - source_labels: [__param_target]
          target_label: instance
        - target_label: __address__
          replacement: blackbox-exporter:9115
This uptime rule will alert you when a probe failed for 5 minutes.
groups:
- name: uptime-rules
  rules:
      - alert: site_down
        expr: probe_success == 0
        for: 5m
        labels:
          severity: warning
        annotations:
          description: '{{ $labels.instance }} of job {{ $labels.job }} has
                        been down for more than five minutes.'
          summary: Instance {{ $labels.instance }} is down
Create the Grafana dashboard
At first create a new dashboard and add a new variable called instance. We will use this variable to make the dashboard interactive and refresh all graphs based on the select instance. 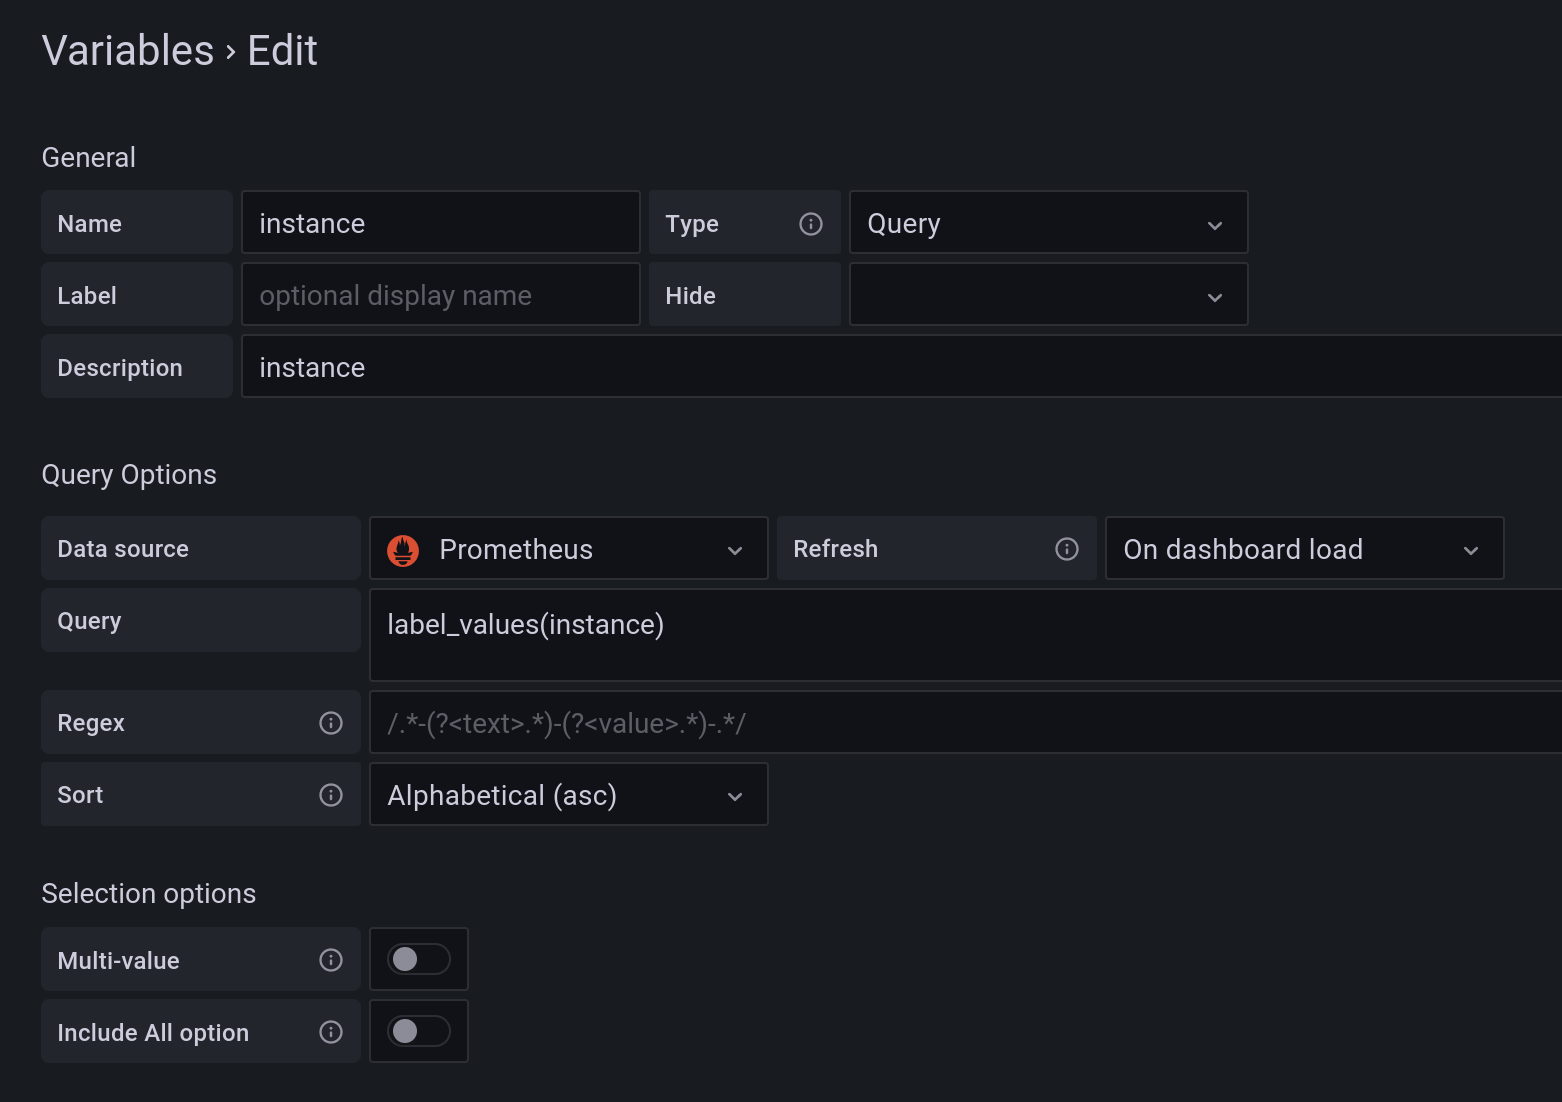
As displayed earlier the dashboard contains two visualizations of the blackbox-exporter. The first one is a single value that can be 0 of the service is down or 1 if the service is up. We use a singlestat to display it within Grafana.
For the singlestat we use the previously defined variable to dynamically update the statistics.
probe_success{instance="$instance", job="blackbox-http"}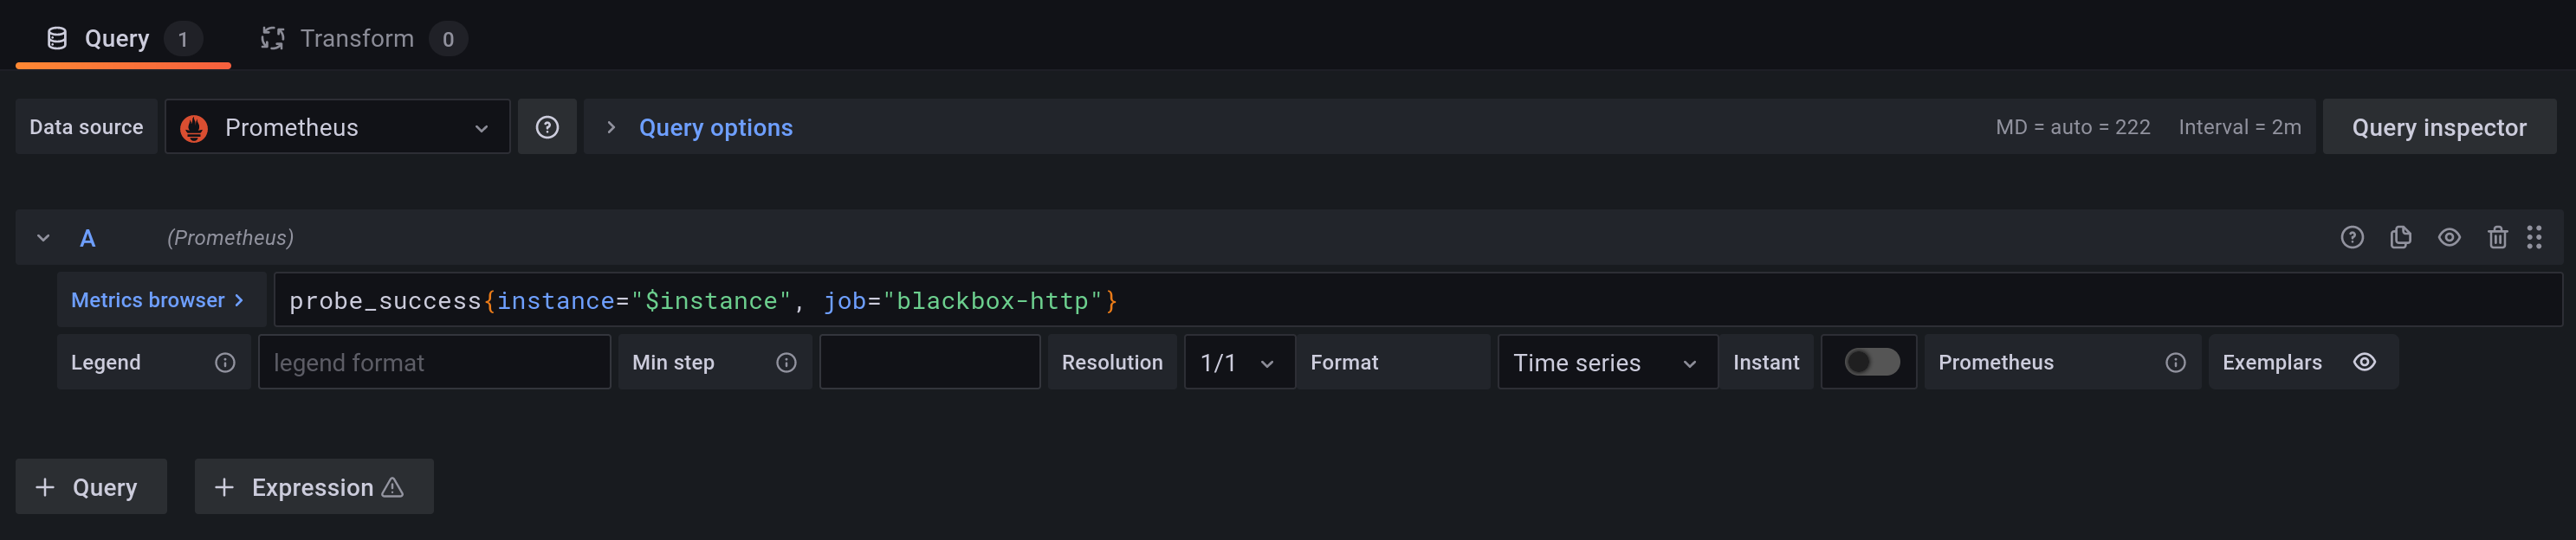
The second visualization is a graph of the actual probe duration. You can use it to determine if a service is responding slowly. Besides that it might be a good idea to also create an alert based on the probe duration.
probe_duration_seconds{instance="$instance", job="blackbox-http"}Deploy with docker compose
As always this setup will be deployed via containers. The following docker-compose.yaml provides all needed services and their configurations.
version: "3"

volumes:
    prometheus_data: {}
    grafana_data: {}

services:
  prometheus:
    image: prom/prometheus:v2.37.0@sha256:56e7f18e05dd567f96c05046519760b356f52450c33f6e0055a110a493a41dc4
    volumes:
      - ./prometheus/:/etc/prometheus/
      - prometheus_data:/prometheus
    command:
      - '--config.file=/etc/prometheus/prometheus.yml'
      - '--storage.tsdb.path=/prometheus'
      - '--web.console.libraries=/usr/share/prometheus/console_libraries'
      - '--web.console.templates=/usr/share/prometheus/consoles'
    ports:
      - 127.0.0.1:9090:9090
    links:
      - alertmanager:alertmanager
    restart: always

  alertmanager:
    image: prom/alertmanager:v0.24.0@sha256:088464f949de8065b9da7dfce7302a633d700e9d598e2bebc03310712f083b31
    ports:
      - 127.0.0.1:9093:9093
    volumes:
      - ./alertmanager/:/etc/alertmanager/
    restart: always
    command:
      - '--config.file=/etc/alertmanager/config.yml'
      - '--storage.path=/alertmanager'

  grafana:
    image: grafana/grafana:9.0.5@sha256:6847695bc353a659a18c6f44bd0b5a94de5d2eeff995a671db6e982370dfe4e8
    depends_on:
      - prometheus
    ports:
      - 127.0.0.1:3000:3000
    volumes:
      - grafana_data:/var/lib/grafana
      - ./grafana/provisioning/:/etc/grafana/provisioning/
    env_file:
      - ./grafana/config.monitoring
    restart: always

  blackbox-exporter:
    privileged: true
    image: prom/blackbox-exporter:v0.21.1@sha256:7a255982b24ed3d142f78075a7d8af976355b6f62cec60c573ee115c1beb1d0c
    restart: always
    command:
        '--config.file=/config/blackbox.yml'
    ports:
        - '127.0.0.1:9115:9115'
    volumes:
        - './blackbox-exporter/blackbox.yml:/config/blackbox.yml'
Conclusion
And that's it! This is a way to monitor most of my services, as I don't care that much about application metrics and only want to be disturbed if something is really not working (like the service is down). As always I enjoy hosting services I use myself and reuse services I'm already running. (I also use this stack to get system metrics which I don't actually use for anything but fancy graphs).
This way of blackbox monitoring is a good fit if you simply want to check if a service can be reached from the outside. But keep in mind, that you should not host your monitoring stack on the same host as your actual user facing services!
If you want to be sure that your services are reachable, you could use multiple sites for uptime checks. Or use different providers like the earlier mentioned pingdom or uptimerobot.
You can find all docker/config files at GitHub.